Energy, waste & water reporting for real estate
Software systems that help you focus on sustainability management for cost savings, carbon reduction and tenant satisfaction.
Get started today with a Free Trial.

Trusted for sustainable real estate management


How is energy used in real estate?
A first step toward improved sustainability is being more efficient in your energy use. Knowing exactly where energy is going can help you to quickly identify opportunities.
Colour contrast assist:
Commercial real estate is any multi-family residential, office, industrial, or retail property that can be bought or sold in a real estate market. Energy use is the single largest operating expense in commercial office buildings, representing approximately one-third of typical operating budgets. Globally, real estate accounts for over 30% of CO2 emissions.
By becoming more energy efficient, real estate organizations can reduce operating expenses, increase property asset value, and enhance the comfort of tenants. The chart above shows average energy consumption by area for real estate properties (source: US EIA).
Net-zero & Science Based Targets - where we may be headed...
Helping organizations with their net-zero ambitions is hugely important to our team at EnergyElephant, which is why we keep an eye on the global emissions scenarios as they develop.
This chart shows projected emissions by the end of this century, depending on the actions taken globally.
As you can see, there is an enormous gap between where we are currently headed and where we need to be if we hope to restrict global warming to 1.5°C.
Data for this chart comes from Climate Action Tracker.
How is EnergyElephant Helping real estate?
By working closely with energy and sustainability teams in real estate, EnergyElephant has developed services adapted to the requirements of managing energy and sustainability for property portfolios at different scales.

All of your buildings and utilities in a single system
EnergyElephant provides for key considerations of real estate energy management, including performance modeling, forecasting, site comparison, compliance reporting and driving behavioural change.
By centralising and standardising data from all utility providers and accounting for regional charges, taxes, emission factors etc. the platform simplifies reporting across your property portfolio, regardless of location.

Prepare Reports for GRESB
GRESB is an international organization that provides ESG benchmarks for the real estate industry. EnergyElephant helps real estate companies manage their data so they can report on the environmental performance of their assets and portfolios.

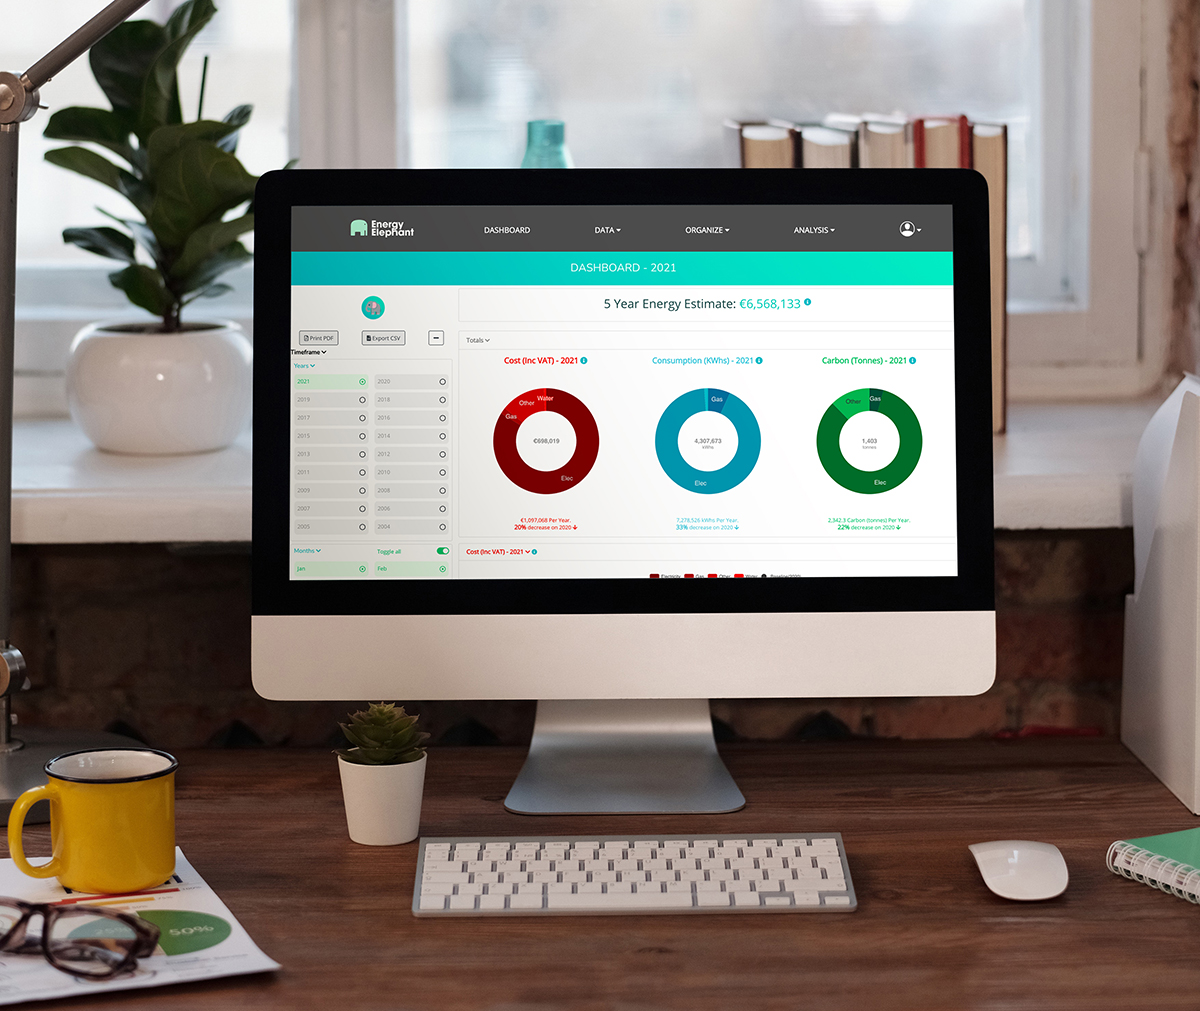
Manage energy data and sustainability data, all in one place
See all of your utility data for cost, usage and environmental impact in one place, with preconfigured dashboards and reports to simplify how you measure, plan, track and act.
EnergyElephant can quickly identify new efficiencies across your sites and save you time on planning projects and reporting results.
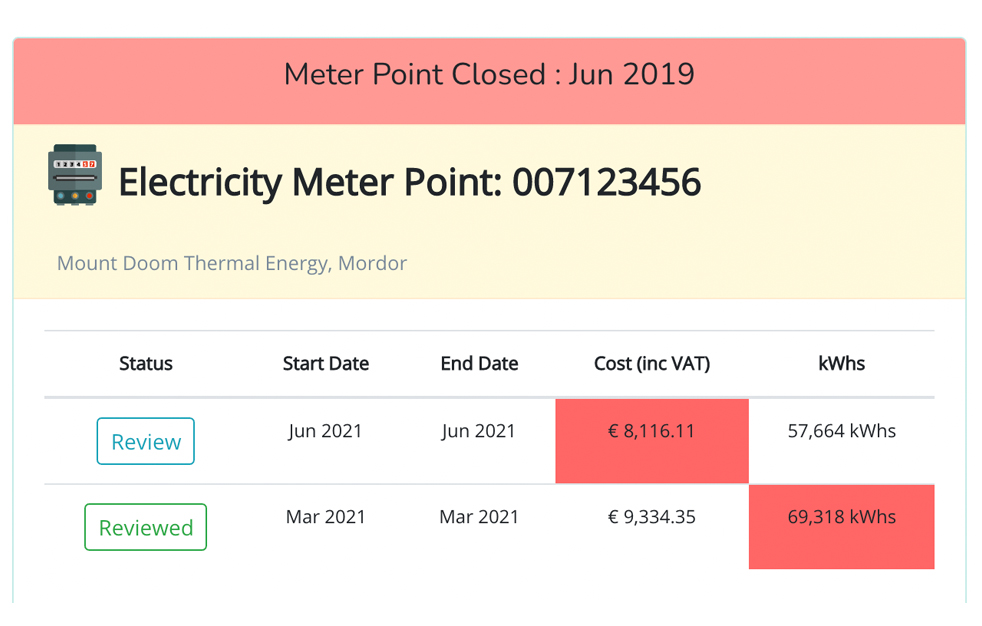
Utility bill validation and management
EnergyElephant can automatically retrieve bills from your supplier and store them, whilst extracting detailed data from each bill.
This simplifies bill checking and data capture so that you can focus on more important tasks and only review bills that are flagged as problematic.
You can also upload your original bills and data in bulk and they will be processed into the system in seconds.
Easy to understand and report
We know that sustainability reports need to be shared with people who are not experts in the area. For that reason we make sure everything in EnergyElephant is easy to understand and simple to use so that you can report and communicate effortlessly.
Share access to specific assets and views with your team or download charts and data for use in your own reports or for reporting frameworks such as Task Force for Climate Related Financial Disclosures (TCFD), Carbon Disclosure Project (CDP) and ISO 50001.
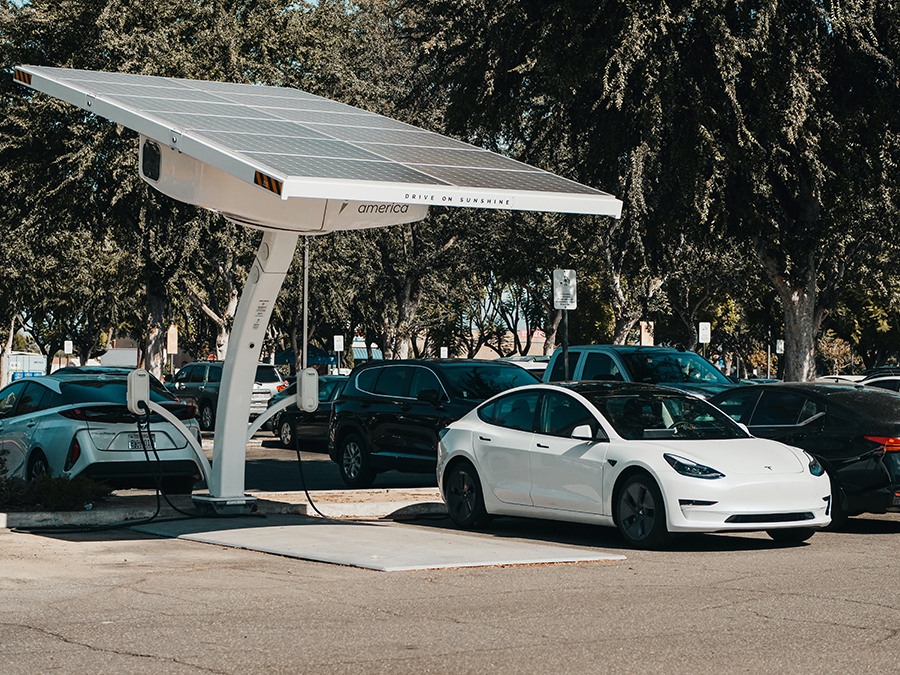
Accounting for energy from your on-site renewables
The ability of organizations to generate their own energy through solar, wind and other renewable sources is a key aspect of the net-zero transition.
EnergyElephant supports effective monitoring and accounting of energy exports via sub-metering.
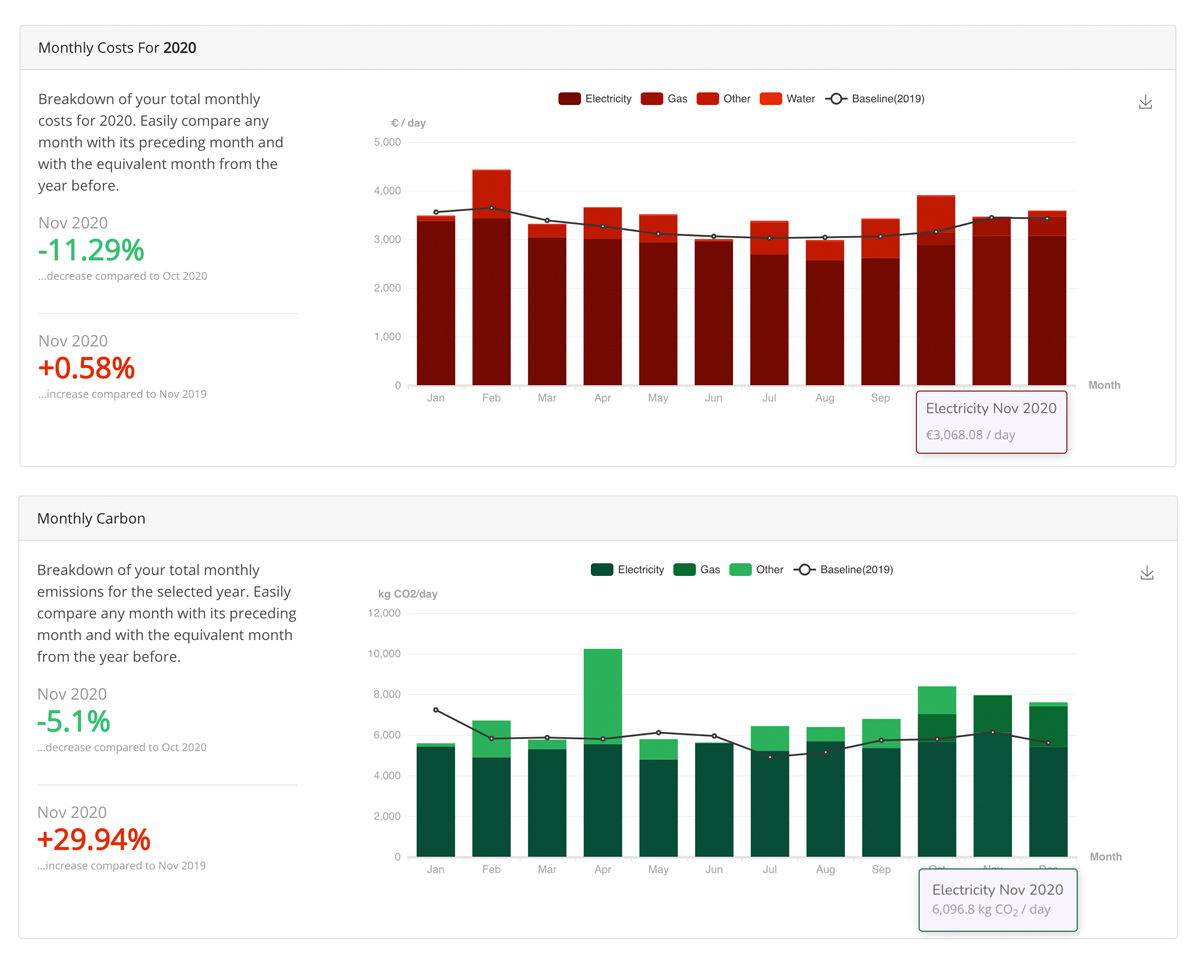
Identify energy saving opportunities
EnergyElephant visualizes energy consumption to help you identify inefficiencies and respond to problematic trends.
Track energy usage out of hours, monitor start-up and shutdown times and quantify energy baseloads.
Assess performance of divisions and buildings against custom KPIs (such as production activity, staffing, floor area etc.) to clearly quantify efficiency across your organization.

Save money on energy and time for your team
EnergyElephant can keep your costs down by checking your unit rates against competitive rates in the market based on your actual usage.
Based on your consumption it can show you which energy sources are cheaper to use for your requirements.
EnergyElephant also monitors your contract discounts and highlights when its time to switch or renegotiate your contract.

Secure and accessible data for your organization
EnergyElephant secures all of your data in custom designed cloud services, meaning you’ll always have access when you need it.
By centralising your utilities data with EnergyElephant, With EnergyElephant you can change your supplier whenever you want, safe in the knowledge your historic and future data will remain secure and accessible.

Public dashboards to increase engagement across your organization
Helping people to understand the changes they can make and how those changes contribute to transformative action is a key part of sustainability programmes.
EnergyElephant offers public-facing views of your data that can be used to educate stakeholders and other departments on the bigger picture of sustainability goals and your progress toward achieving them.
Be more sustainable
EnergyElephant visualizes your use of utilities to help you identify inefficiencies and respond to problematic trends.
Assess performance of divisions and buildings against custom KPIs (such as production activity, staffing, floor area etc.) to clearly quantify efficiency across your organization, in energy, water, waste and emissions.

Carbon price modelling
EnergyElephant enables organizations to set preferred carbon prices and see how their net-zero trajectory is affected.
This supports longer term planning for the financial costs and benefits of transitioning businesses into a cleaner, more sustainable future.

Contact us
We can help you reach your sustainability goals and achieve Net Zero. Let us know the challenges you are looking to solve and our team will be in touch.