
Energy & Sustainability Management For Multinationals & Tech Companies
An all-in-one software system that helps multinational and technology companies simplify energy and sustainability management, reduce utility costs and carbon emissions, and manage environmental performance across global operations.
Get started today with a Free Trial.

Trusted By Multinational And Technology Companies Focused On Better Energy And Sustainability Performance



How Is Energy Used In Multinational & Tech Companies?
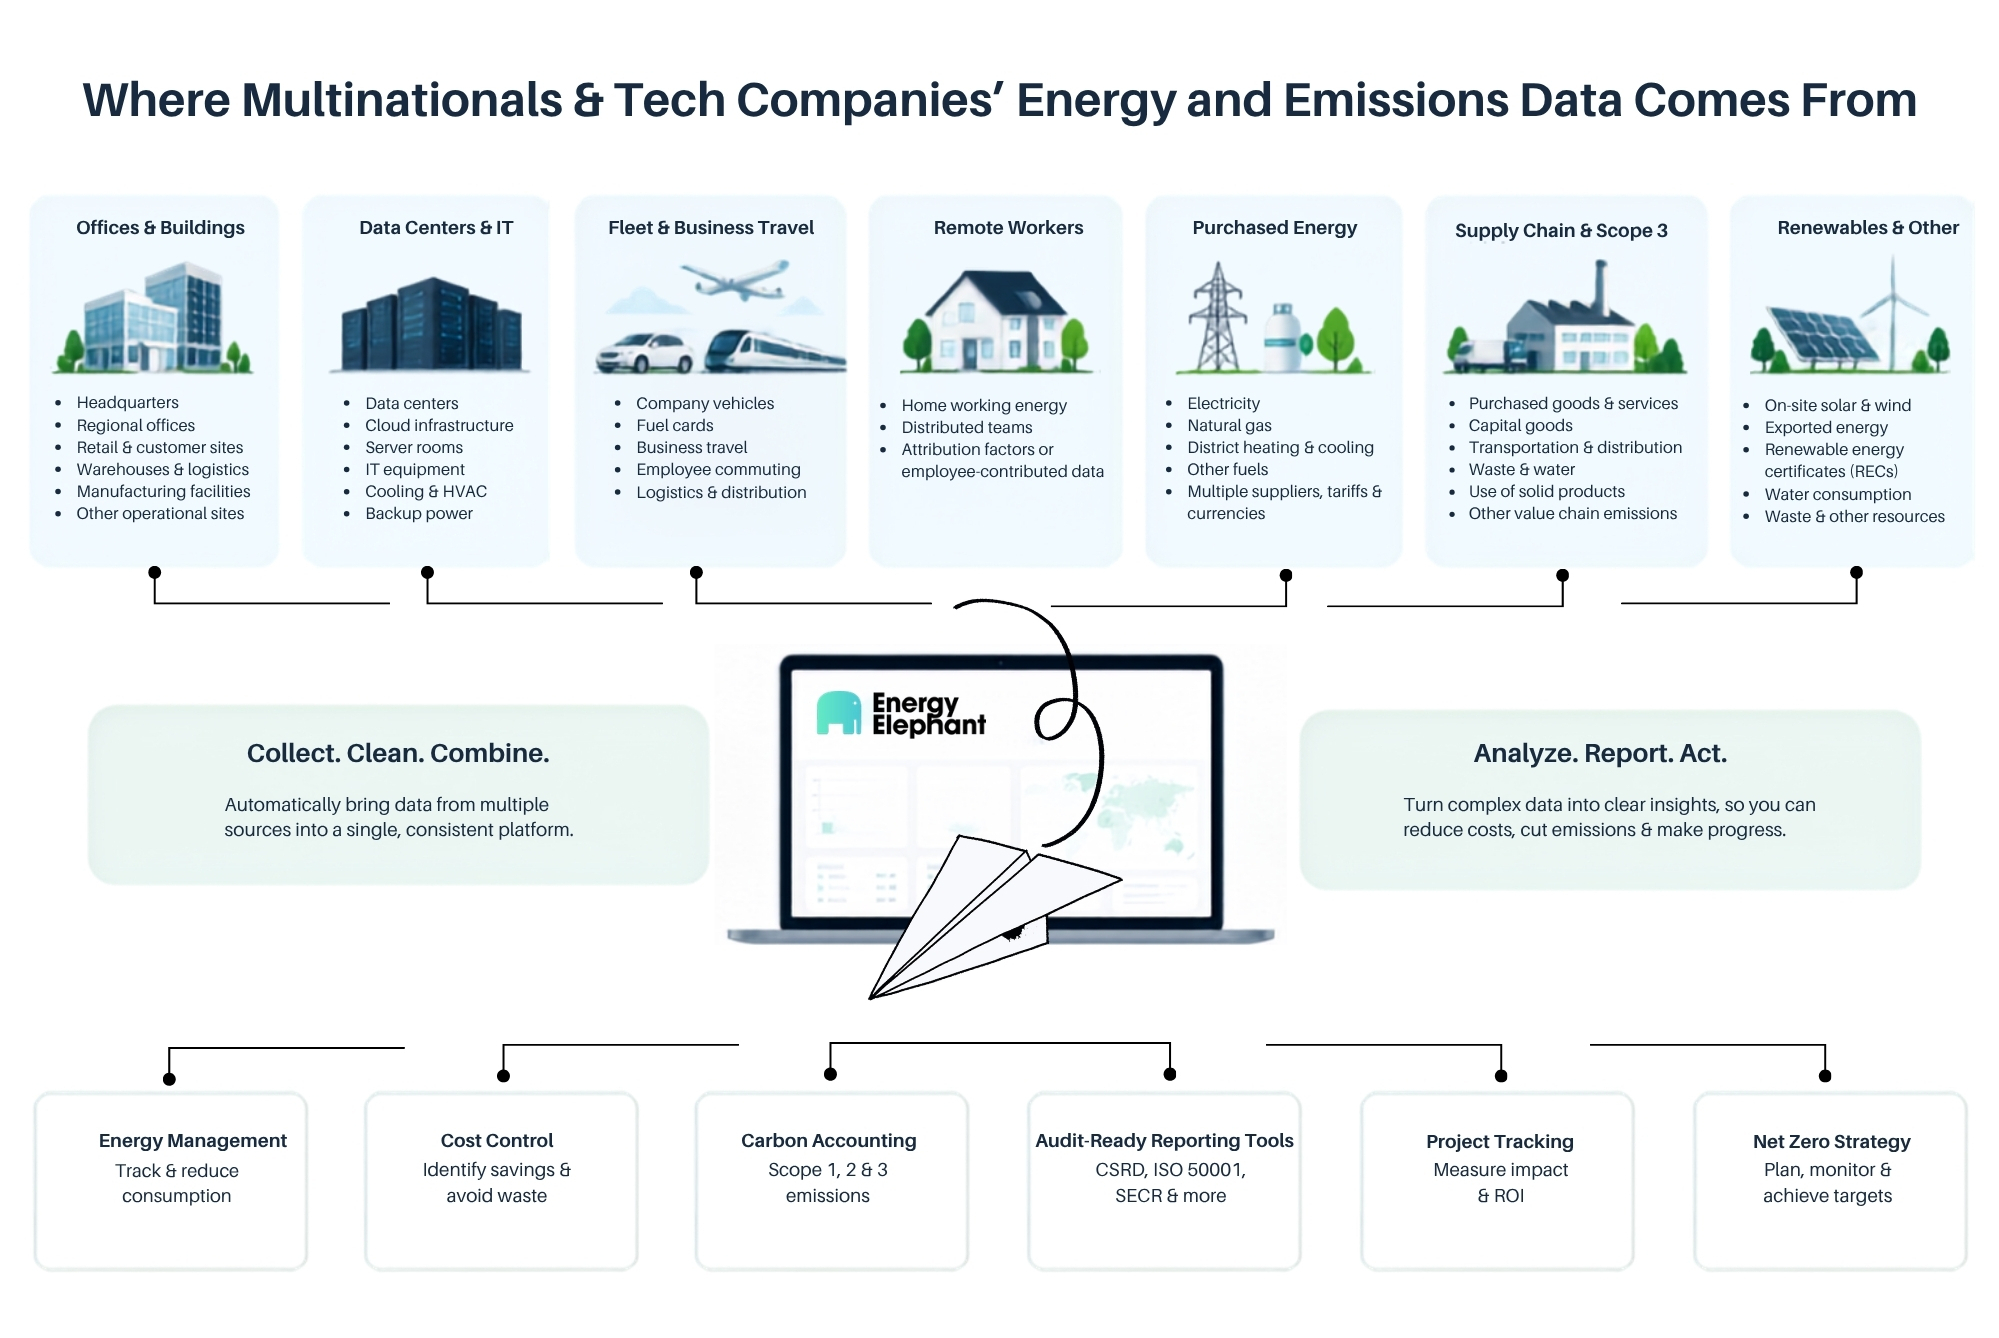
Large multinational and technology companies can have complex energy and carbon footprints spanning offices, data centers, operational/production facilities, vehicle fleets, remote teams, suppliers, and other parts of their global value chains.
The exact profile varies significantly from one organization to another. A multinational business may operate hundreds of sites across different countries, energy markets, utility providers, and currencies. Technology companies can face many of the same challenges, while also managing energy-intensive IT infrastructure and data centers.
This complexity makes reliable data increasingly important. Energy and Sustainability teams need to understand not only how much energy and water their organization consumes, but where and when it is being used, how much it costs, and the resulting greenhouse gas (GHG) emissions.

For technology businesses in particular, the growth of cloud computing, digital services, and artificial intelligence (AI) is increasing the importance of data center energy management. Power Usage Effectiveness (PUE) is typically used as the primary key performance indicator (KPI) for measuring data center energy efficiency.
In December 2024, the U.S. Department of Energy (DOE) reported that data centers consumed around 4.4% of total U.S. electricity in 2023. A June 2026 update from Lawrence Berkeley National Laboratory estimates that data centers could account for 11.8% of U.S. electricity consumption by 2030, with scenarios ranging from 9.5% to 15.3%.
In Ireland, which serves as a major European tech hub, data centers accounted for 23% of all metered electricity consumption in 2025, compared with 18% for urban households.
The issue is also receiving increasing attention in Europe. Under the EU Energy Efficiency Directive, data center operators are subject to monitoring and reporting requirements covering energy performance, with the European Commission maintaining a database containing information relevant to both energy performance and water footprint.
Managing Carbon Across A Global Value Chain
For large companies, energy consumed directly within offices and facilities can be only one part of their overall carbon footprint.
The GHG Protocol divides corporate GHG emissions between Scope 1 direct emissions, Scope 2 emissions associated with purchased energy, and Scope 3 indirect emissions occurring throughout the company's value chain. Its Scope 3 Standard covers 15 categories of upstream and downstream emissions, encompassing purchased goods and services, capital goods, transportation and distribution, business travel, employee commuting, leased assets, and the use and end-of-life treatment of sold products.
This makes data management a significant challenge for multinational organizations. Information may need to be collected from different business units, facilities, suppliers, systems, countries, and teams before it can be transformed into a consistent corporate emissions inventory.
For companies operating in Europe, sustainability disclosure requirements add another dimension. Companies within the scope of the EU's Corporate Sustainability Reporting Directive (CSRD) report according to the European Sustainability Reporting Standards (ESRS). The European Commission adopted revised ESRS in July 2026 as part of changes intended to simplify sustainability reporting while maintaining high-quality disclosures.
Reliable underlying data therefore matters for more than annual reporting. Creating a consistent view of energy, carbon, costs, and environmental performance can help organizations identify opportunities, track progress against targets, and make better-informed decisions throughout the year.
What are companies saying?
View case study“Great way to monitor your energy costs. Exceptional customer service. Clear interface, easy to use functions, all information in one place.”
How Does EnergyElephant Help Multinationals & Tech Companies?
Multinational and technology companies can generate enormous volumes of energy and sustainability data across offices, data centers, facilities, fleets, suppliers, and distributed teams.
When that information is spread across utility portals, invoices, smart meters, spreadsheets, IoT systems, and different business units, producing a consistent picture of performance can become difficult and time-consuming.
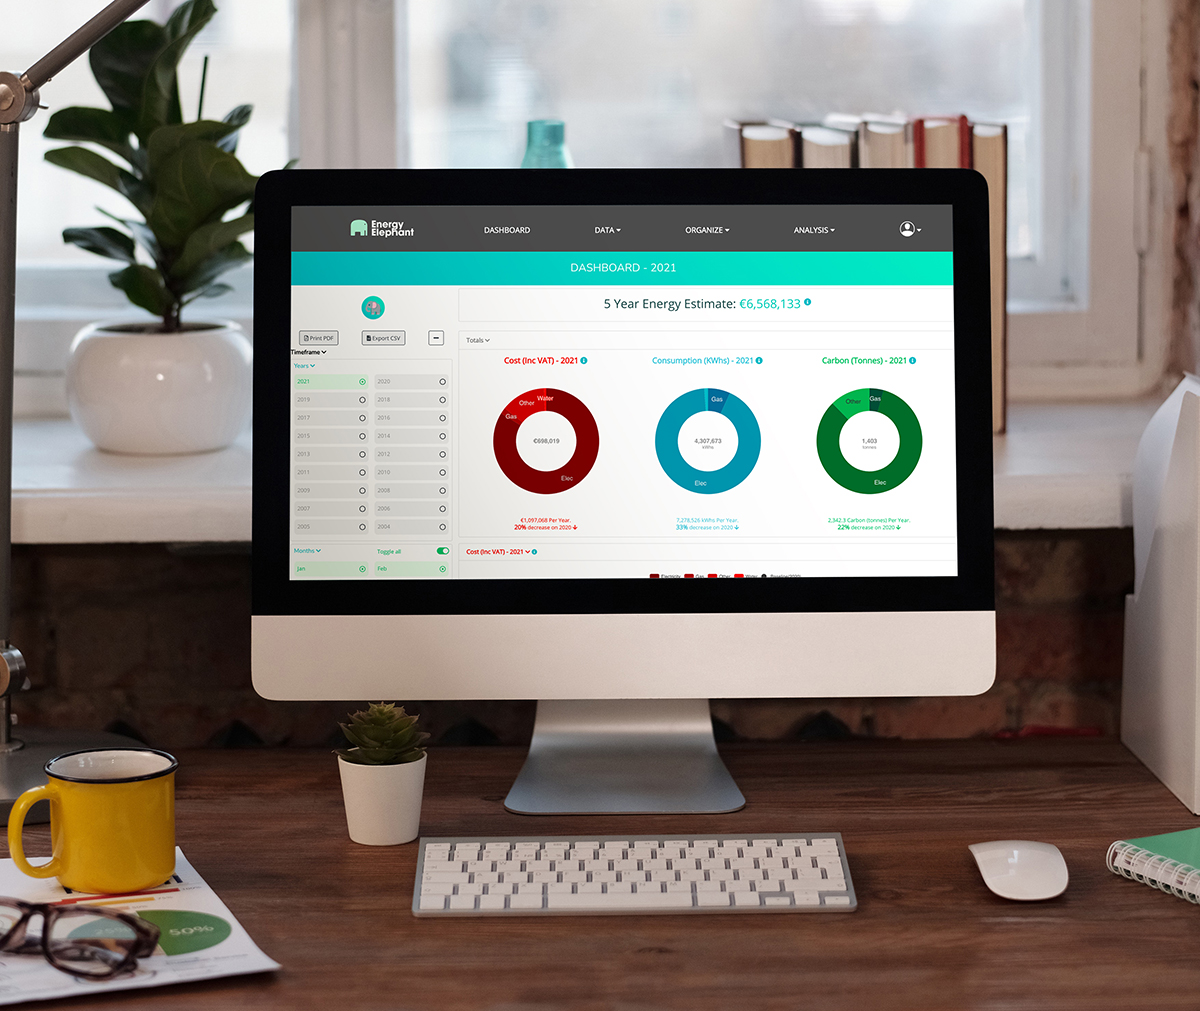
EnergyElephant brings energy and sustainability information together into one central platform, giving Finance, Sustainability, Operations, and Facilities teams a clearer, simplified view of consumption, costs, and carbon emissions across individual sites and the wider organization.
The platform is designed to support the challenges associated with large teams operating across multiple global locations, including distributed offices and remote workers.
One Source Of Truth Across Global Operations
Managing energy across multiple countries can mean dealing with different suppliers, tariffs, languages, currencies, billing formats, meter points, data sources, and reporting structures.
EnergyElephant centralizes utility and sustainability data so teams can view performance across the entire organization while still drilling down to individual regions, sites, buildings, divisions, or meters.
Pre-configured dashboards and reports make it easier to understand cost, consumption, and environmental impact without repeatedly consolidating information manually. Different stakeholders can also work from the same underlying information. Instead of Finance, Sustainability, Operations, and Facilities maintaining separate versions of the data, teams can establish a consistent foundation for analysis and reporting.
Manage Data Centers & Energy-Intensive Technology Infrastructure
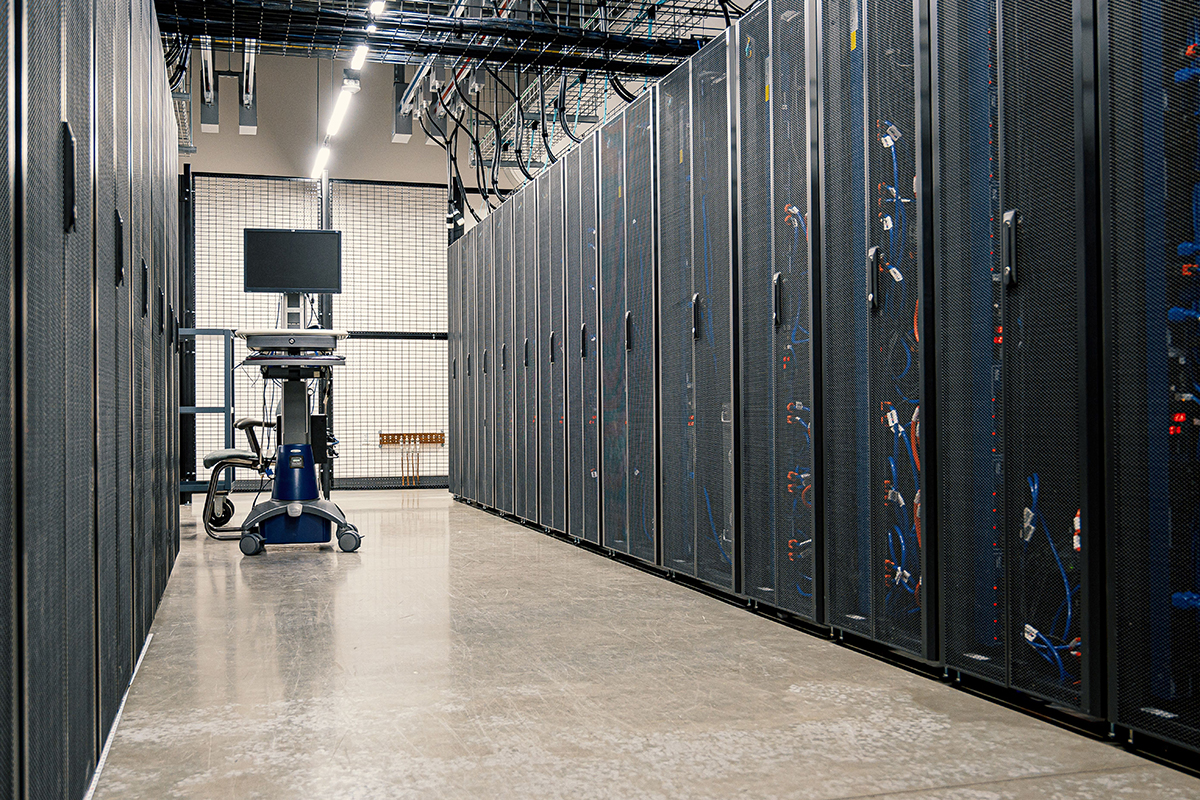
For organizations operating data centers or other energy-intensive IT infrastructure, granular energy data can help teams understand how these facilities are performing.
Growing computing requirements can create significant electricity and cooling loads, while the rapid growth of AI infrastructure is contributing to rising electricity demand.
EnergyElephant brings utility bills, smart meter, sensor, and detailed interval data together in one place, giving teams a more granular view of when and where energy is consumed. This helps identify baseload consumption, periods of peak demand, and inefficient energy-use patterns across energy-intensive facilities.
For European data center operators facing specific energy-performance monitoring and reporting requirements, maintaining structured, reliable energy data can also provide an important foundation for compliance processes.
Benchmark Sites & Identify Energy-Saving Opportunities
When a company operates dozens or hundreds of locations, its own portfolio becomes a valuable source of insight.
EnergyElephant visualizes energy consumption to help teams identify inefficiencies and problematic trends. Organizations can assess buildings and divisions against custom KPIs such as floor area, staffing, or operational activity, helping quantify relative efficiency across the business.
Teams can investigate out-of-hours consumption, unusual baseloads, start-up and shutdown times, and other patterns that may indicate avoidable energy use. This allows multinational Energy and Sustainability teams to focus attention on sites and activities where the data indicates the greatest opportunity, rather than applying the same interventions everywhere.

Automate Utility Bills, Validation, & Cost Management
Utility data collection can become a major administrative task when an organization has accounts with multiple suppliers across a large portfolio.
EnergyElephant can automatically retrieve utility bills from suppliers, store the original documents, and extract detailed billing information. Bills and historic data can also be uploaded in bulk. Automating this process reduces manual data entry and simplifies bill checking, allowing teams to focus their attention on accounts that require review.
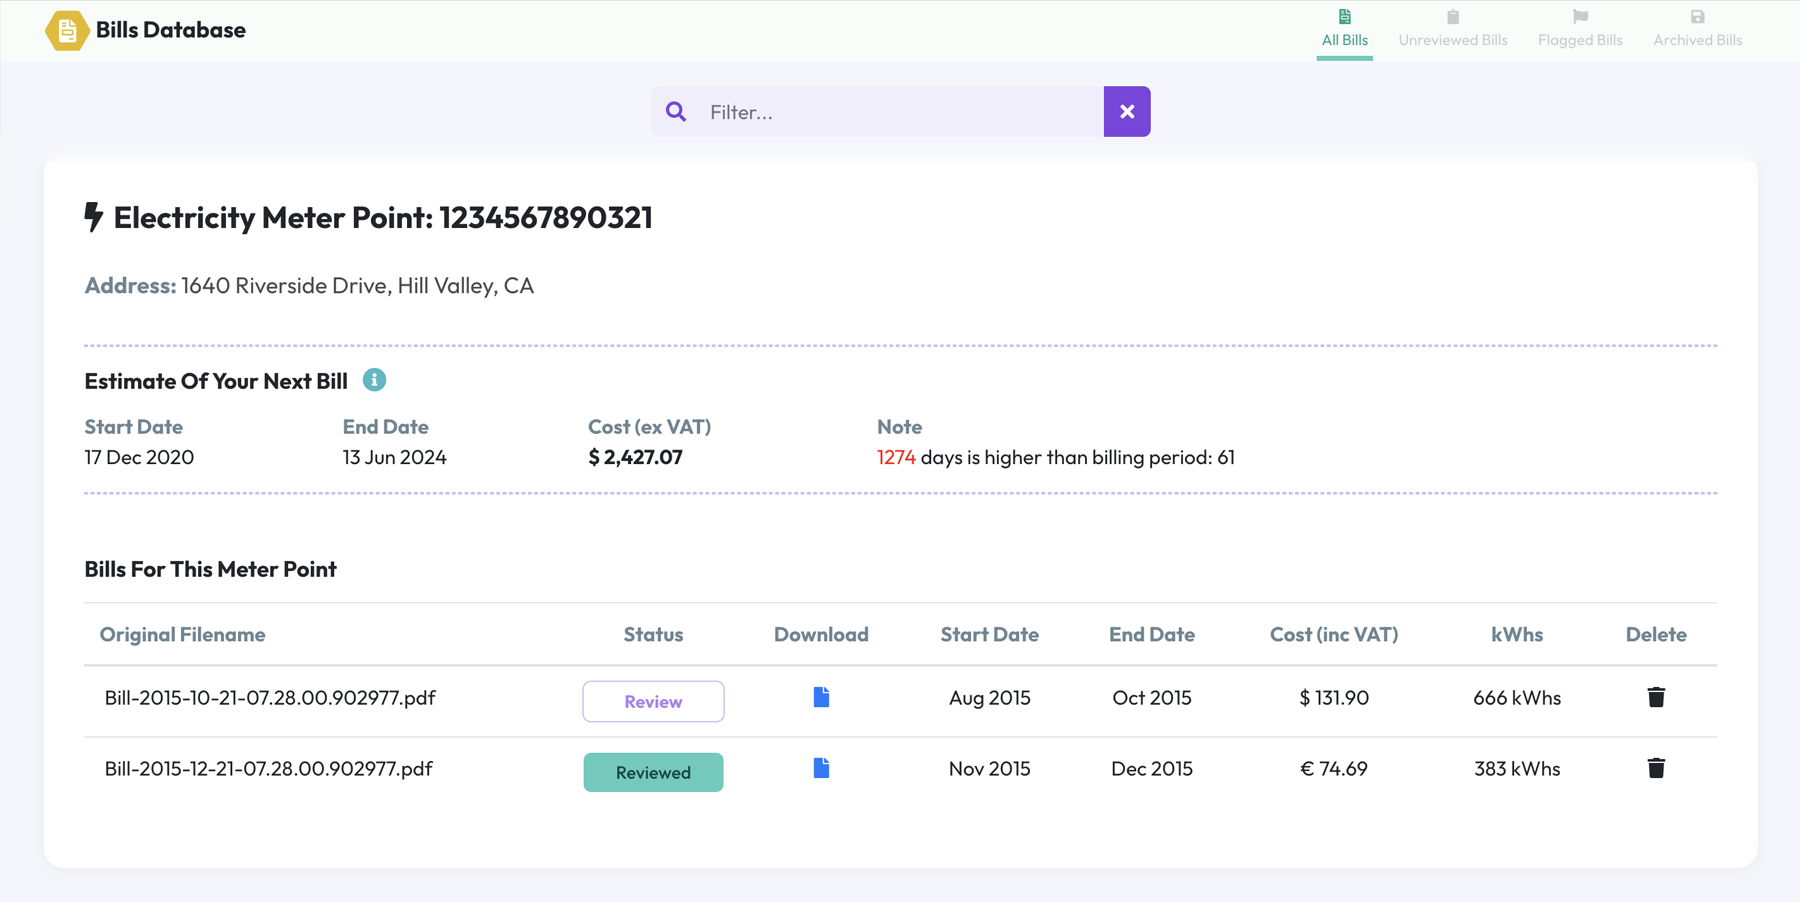
For organizations managing complex energy costs, EnergyElephant can also support bill validation and cost analysis, including identifying billing issues and potential tariff or capacity-related opportunities.
The result is a cleaner, more consistent dataset that can support both financial energy management and carbon accounting.
Simplify Carbon Accounting & Sustainability Reporting
Large multinational organizations may need to combine operational energy data with information from fleets, business travel, employees, suppliers, purchased goods and services, and other Scope 3 sources.
EnergyElephant helps organizations centralize and standardize the underlying energy and sustainability data required for GHG accounting, while providing monitoring and reporting of carbon and GHG emissions.
The platform can help automate GHG calculations and provides data audit and export tools to support reporting requirements for CSRD, ISO 50001, SECR, B Corp, and more. This is particularly valuable for global organizations where data quality and consistency can otherwise vary between countries, divisions, facilities, and reporting periods.
Centralizing the underlying information helps teams create a more consistent audit trail, spend less time gathering data for each reporting cycle, and use that same information to manage emissions throughout the year.

Manage Scope 3, Supply Chains, & Distributed Teams
EnergyElephant can be used to quantify energy and emissions associated with supply chains and distributed workforces. Bringing this information together with operational energy data provides Sustainability teams with a more complete picture of the organization's footprint and a stronger foundation for identifying where emissions-reduction efforts should be focused.

Track Renewable Energy Across Your Organization
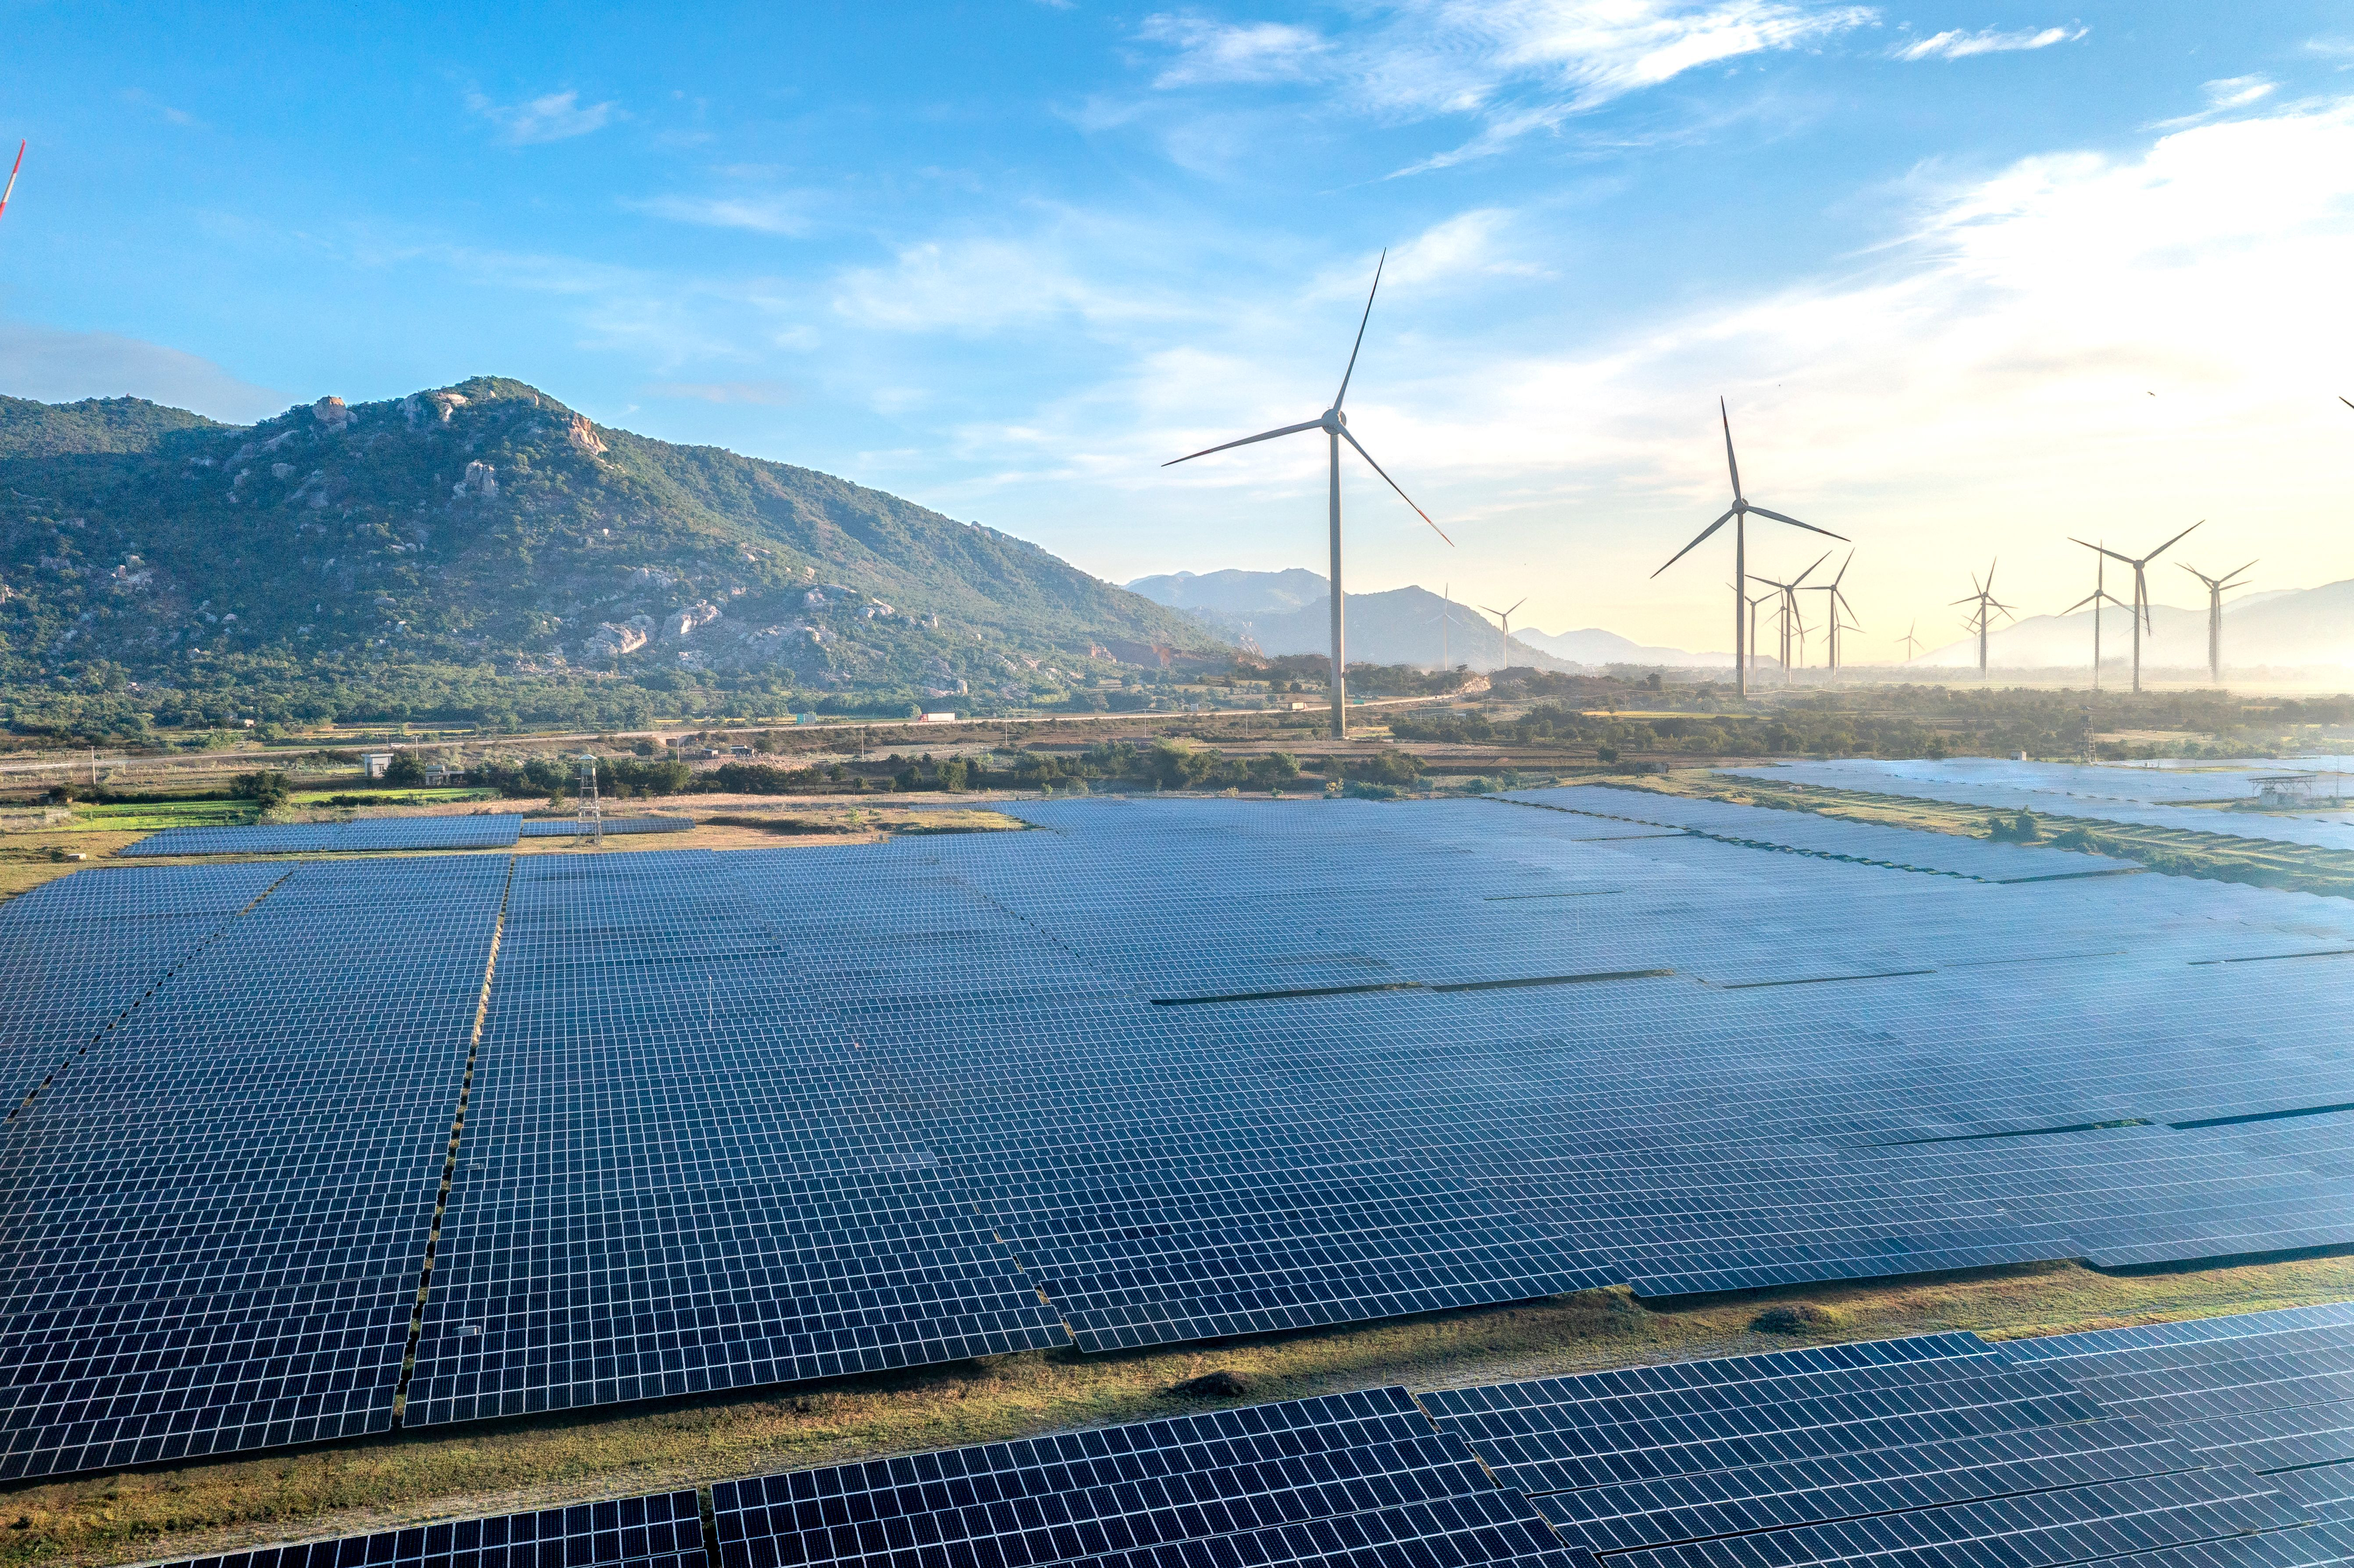
Large organizations are increasingly combining energy efficiency with on-site renewable generation.
EnergyElephant supports monitoring and accounting for energy generated from renewable sources such as solar and wind, including the monitoring of exported energy through sub-metering.
Integrating generation and consumption data allows on-site renewables to be analyzed alongside purchased energy, costs, consumption, and carbon data, providing a clearer view of their contribution to energy performance at individual sites and across the wider portfolio.
Track Sustainability Projects & Demonstrate ROI
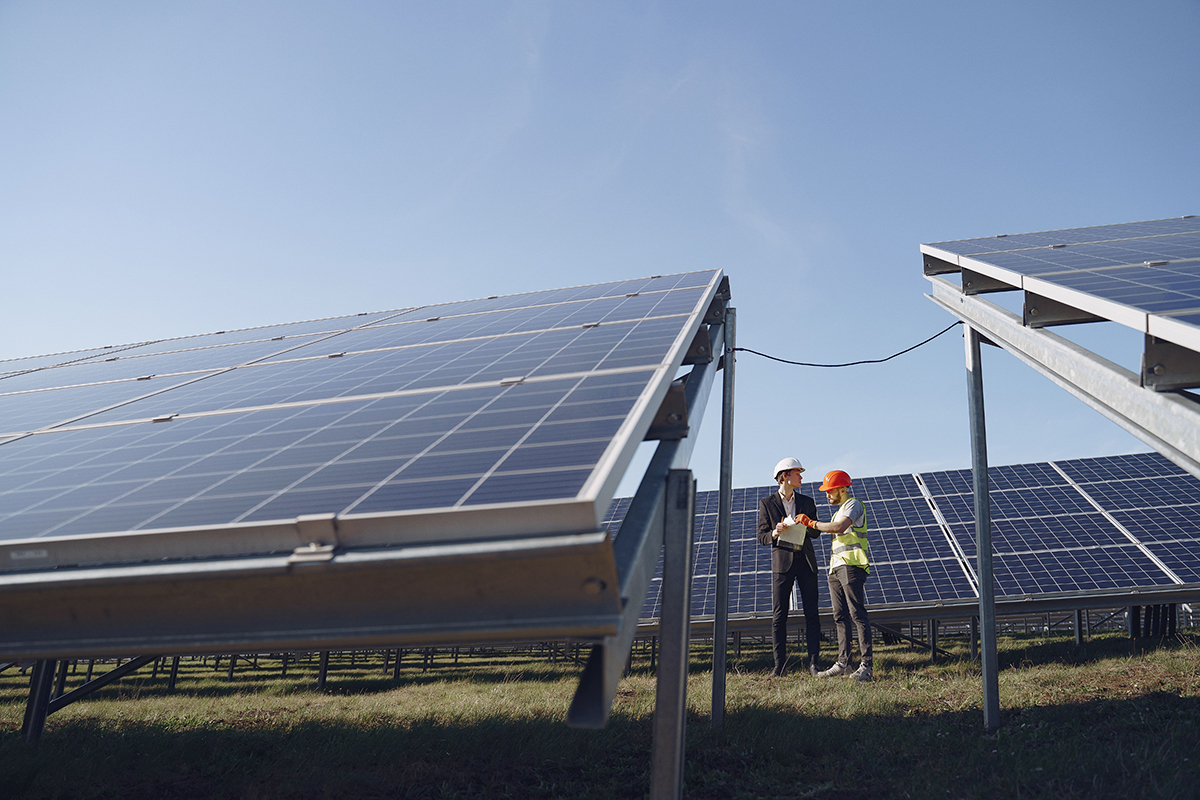
Energy-efficiency and decarbonization projects can require significant capital investment when deployed across a multinational portfolio. That makes measurement important. Decision-makers need to understand whether projects are delivering the savings originally expected, and which initiatives deserve to be scaled across additional locations.
EnergyElephant provides an integrated decarbonization roadmap and tracking toolkit. Using historical consumption data to establish a baseline, organizations can monitor performance following implementation, account for on-site renewable generation, and analyze return-on-investment (ROI) and payback.
This makes it possible to pilot an initiative at selected locations, measure the results using actual energy data, and use the evidence to inform wider investment decisions.
Rather than treating sustainability projects purely as reporting initiatives, organizations can connect environmental improvements with operational and financial outcomes.
Plan For The Financial Impact Of Carbon
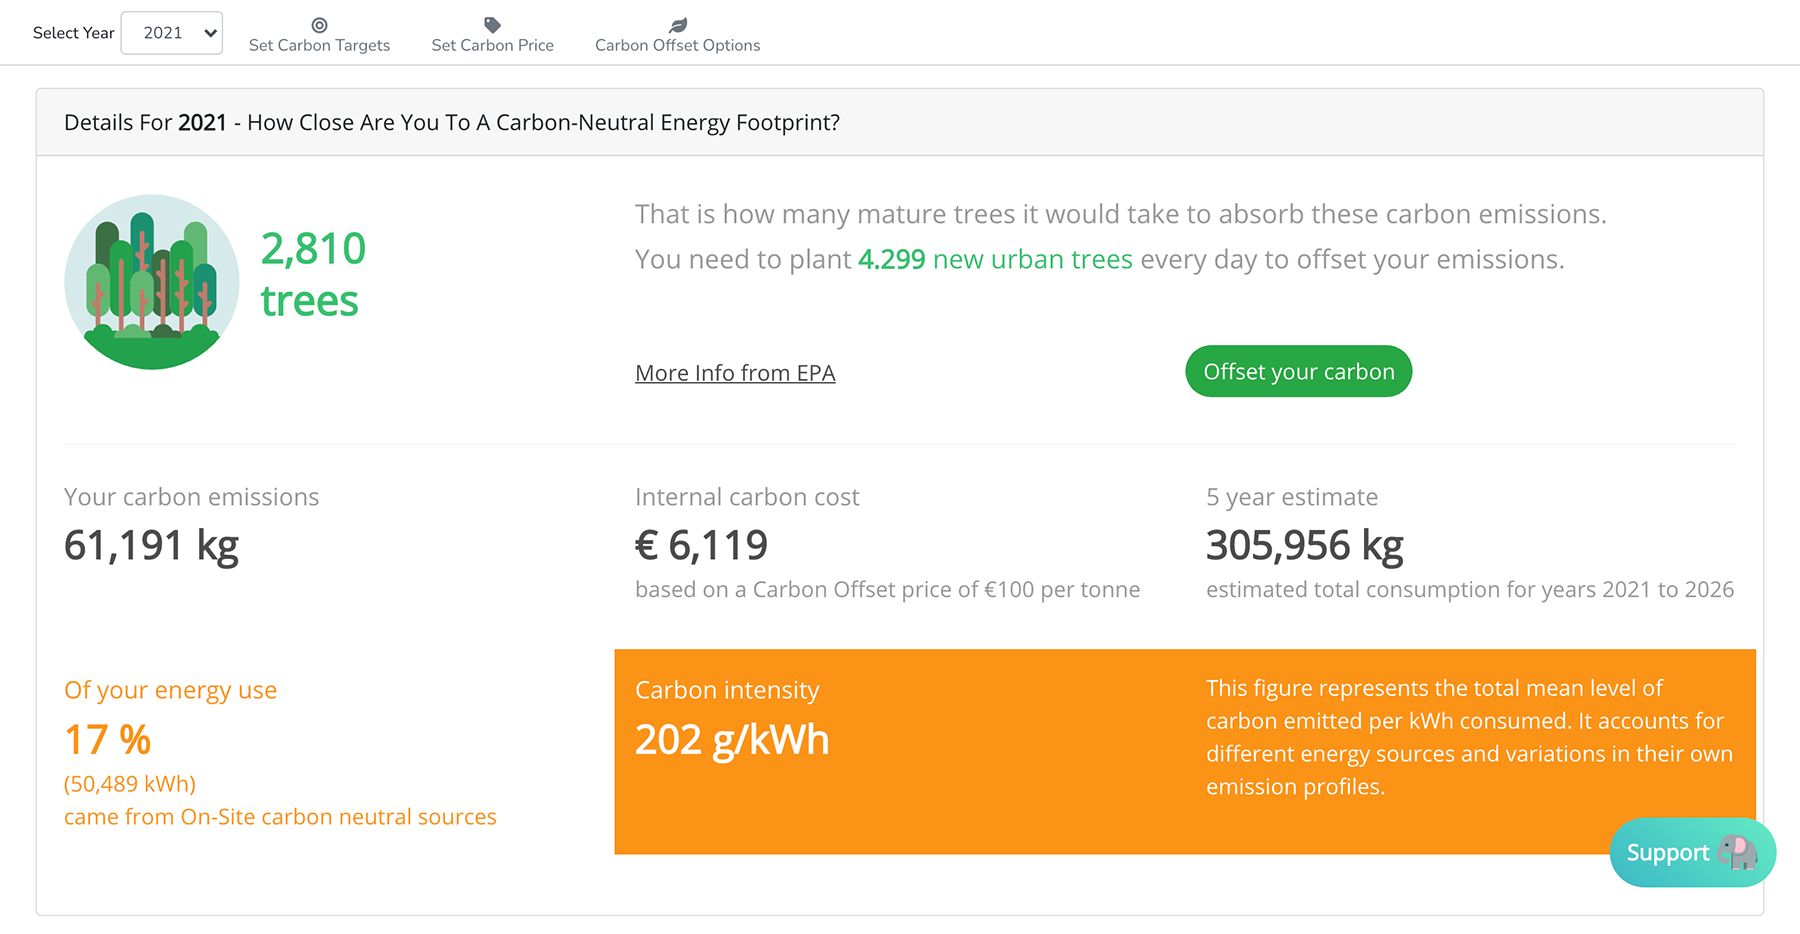
For organizations developing longer-term decarbonization strategies, the future cost of carbon can also influence investment decisions.
EnergyElephant enables organizations to set preferred carbon prices and assess how those assumptions affect their net-zero trajectory.
This can support longer-term planning by helping teams consider the potential financial costs and benefits associated with the transition to lower-carbon operations.

Turn Energy & Carbon Data Into Ongoing Action
Energy, carbon, cost, building, data center, and value chain information can span thousands of data points across different countries, suppliers, teams, and systems.
Bringing that information together allows organizations to identify inefficient sites, investigate unexpected consumption, validate costs, measure carbon emissions, track improvement projects, and demonstrate progress.
EnergyElephant provides one platform to turn fragmented energy and carbon data into continuous measurement, management, and action.
Manage energy data and sustainability data, all in one place
See all of your utility data for cost, usage and environmental impact in one place, with preconfigured dashboards and reports to simplify how you measure, plan, track and act.
EnergyElephant can quickly identify new efficiencies across your sites and save you time on planning projects and reporting results.
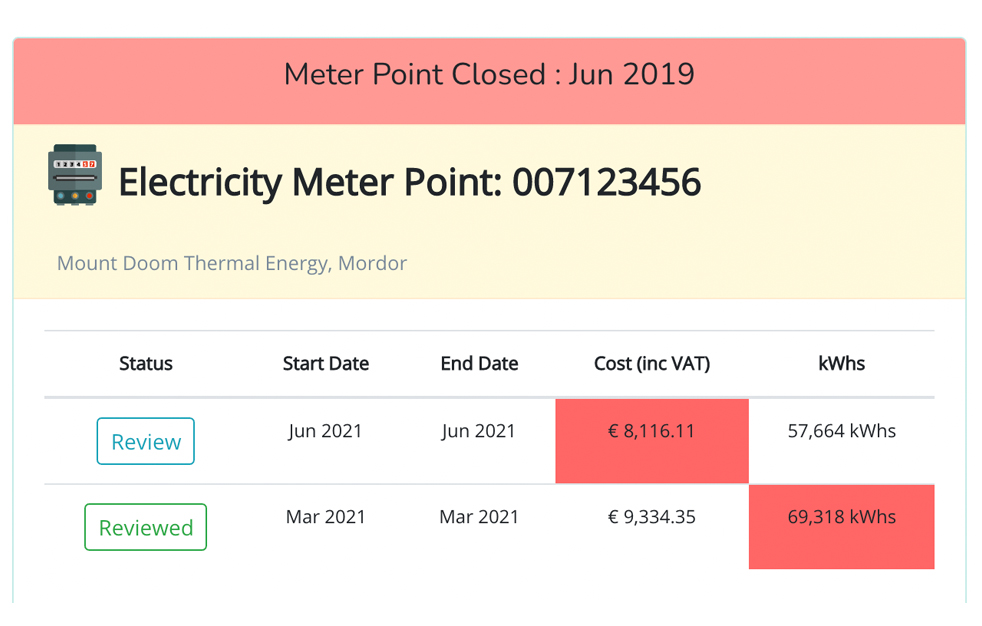
Utility bill validation and management
EnergyElephant can automatically retrieve bills from your supplier and store them, whilst extracting detailed data from each bill.
This simplifies bill checking and data capture so that you can focus on more important tasks and only review bills that are flagged as problematic.
You can also upload your original bills and data in bulk and they will be processed into the system in seconds.
Easy to understand and report
We know that sustainability reports need to be shared with people who are not experts in the area. For that reason we make sure everything in EnergyElephant is easy to understand and simple to use so that you can report and communicate effortlessly.
Share access to specific assets and views with your team or download charts and data for use in your own reports or for reporting frameworks such as Task Force for Climate Related Financial Disclosures (TCFD), Carbon Disclosure Project (CDP) and ISO 50001.
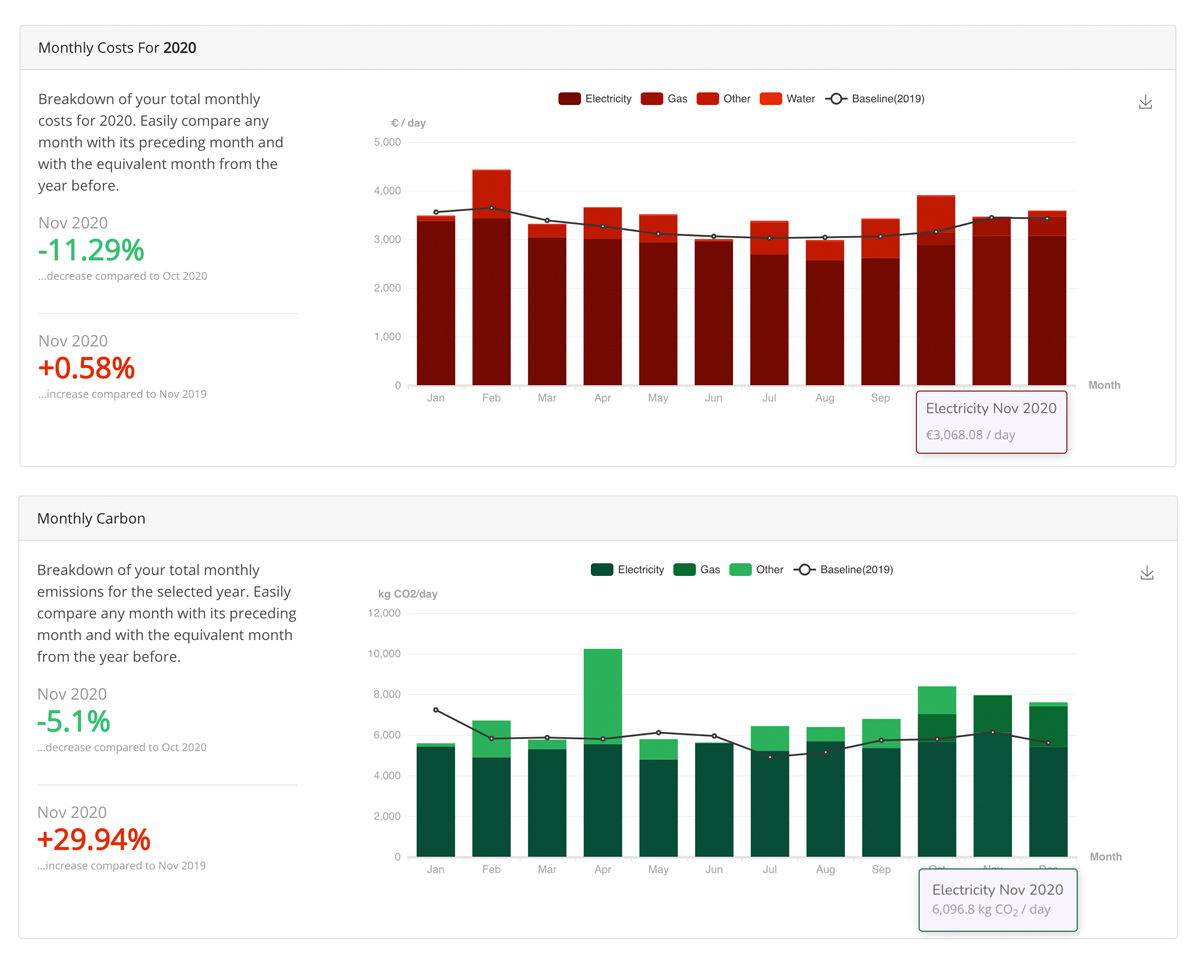
Accounting for energy from your on-site renewables
The ability of organizations to generate their own energy through solar, wind and other renewable sources is a key aspect of the net-zero transition.
EnergyElephant supports effective monitoring and accounting of energy exports via sub-metering.

Identify energy saving opportunities
EnergyElephant visualizes energy consumption to help you identify inefficiencies and respond to problematic trends.
Track energy usage out of hours, monitor start-up and shutdown times and quantify energy baseloads.
Assess performance of divisions and buildings against custom KPIs (such as production activity, staffing, floor area etc.) to clearly quantify efficiency across your organization.

Save money on energy and time for your team
EnergyElephant can keep your costs down by checking your unit rates against competitive rates in the market based on your actual usage.
Based on your consumption it can show you which energy sources are cheaper to use for your requirements.
EnergyElephant also monitors your contract discounts and highlights when its time to switch or renegotiate your contract.
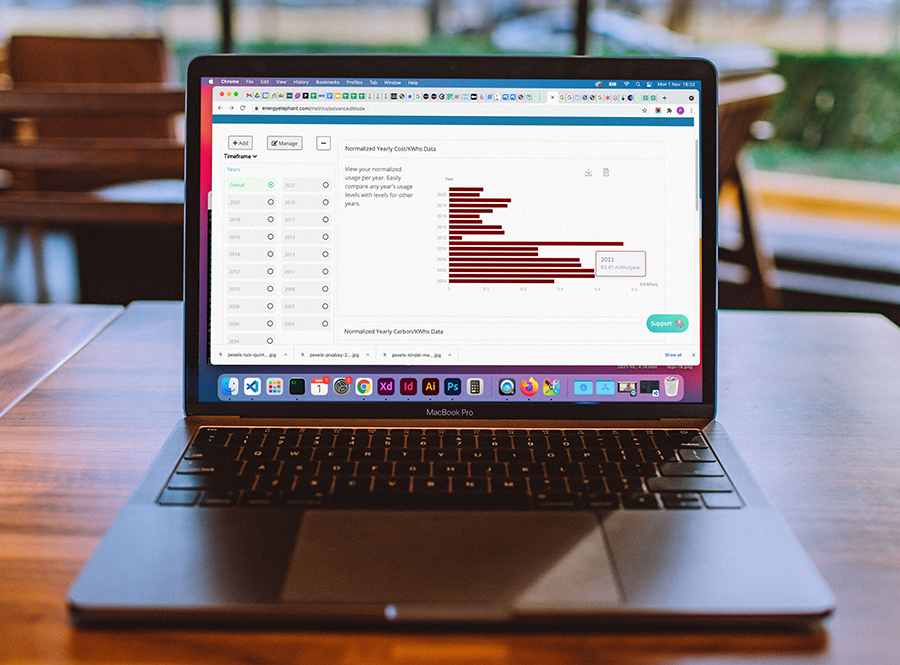
Secure and accessible data for your organization
EnergyElephant secures all of your data in custom designed cloud services, meaning you’ll always have access when you need it.
By centralising your utilities data with EnergyElephant, With EnergyElephant you can change your supplier whenever you want, safe in the knowledge your historic and future data will remain secure and accessible.

Engage Stakeholders & Sustain Momentum
Sustainability success depends on stakeholder engagement. EnergyElephant offers public-facing dashboards to educate staff and the wider public on sustainability goals, helping to foster a "Green Business" culture.
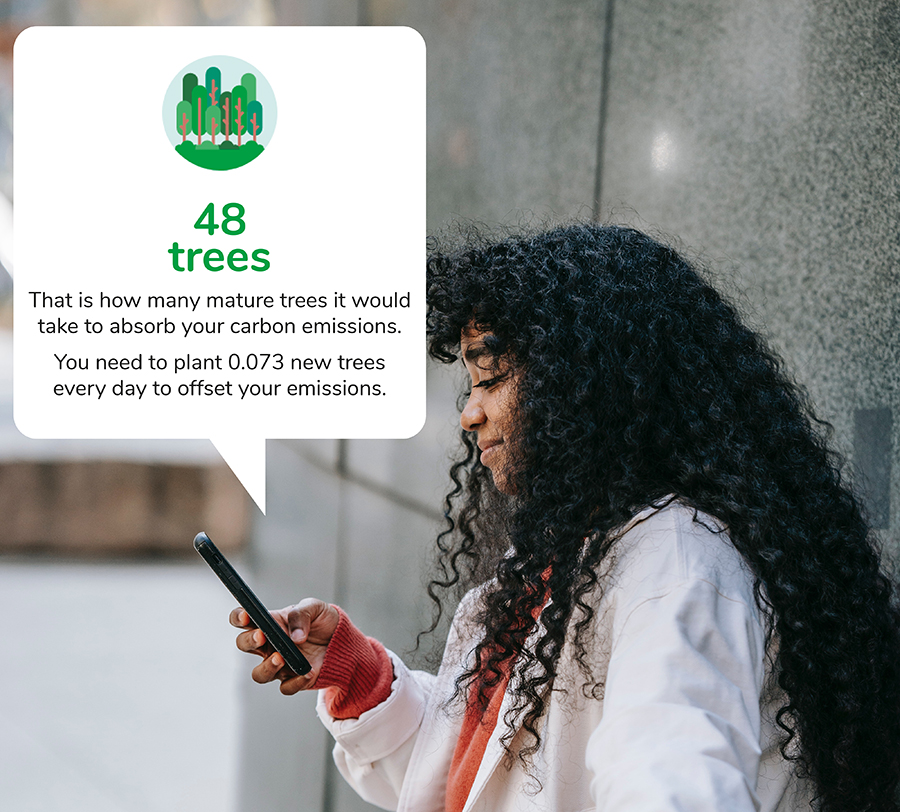
Be more sustainable
EnergyElephant visualizes your use of utilities to help you identify inefficiencies and respond to problematic trends.
Assess performance of divisions and buildings against custom KPIs (such as production activity, staffing, floor area etc.) to clearly quantify efficiency across your organization, in energy, water, waste and emissions.

Carbon price modelling
EnergyElephant enables organizations to set preferred carbon prices and see how their net-zero trajectory is affected.
This supports longer term planning for the financial costs and benefits of transitioning businesses into a cleaner, more sustainable future.

Contact us
We can help you reach your sustainability goals and achieve Net Zero. Let us know the challenges you are looking to solve and our team will be in touch.