
Energy & Sustainability Management For Transport & Logistics
Accelerate your decarbonization journey by automating fleet emissions tracking, optimizing depot / building energy use, and streamlining your transition to zero-emission vehicles.
Get started today with a Free Trial.
Trusted by industry leaders in transport and logistics




Over €3 billion managed to date and counting...
How Is Energy Used In The Transport & Logistics Sector?
Transport and logistics is one of the most energy-intensive and fastest growing sectors, with diesel and petrol fuels continuing to account for the majority of operational energy consumption across commercial road vehicles, air travel, and rail. Beyond vehicle fuel, organizations must also plan and manage electricity and gas across distribution centers, warehouses, stations, maintenance depots, offices, refrigeration systems, and an increasing network of high-capacity electric vehicle (EV) charging infrastructure. As vehicle fleets electrify, understanding the interaction between vehicle charging, site demand, electricity capacities, and tariffs will become just as important as monitoring traditional fuel use.
Managing energy across geographically dispersed operations requires a single, reliable view of both stationary and mobile energy data. By consolidating utility bills, sub-metering, fuel card data, telematics, and EV charging information into one platform, transport operators can identify inefficiencies, reduce fuel and energy costs, improve fleet utilization, and accurately measure carbon emissions across their entire operation.
Net-zero & Science Based Targets - where we may be headed...
The transport and logistics sector is undergoing one of its biggest transformations in decades as organizations respond to rising fuel costs, fuel security threats, stricter emissions regulations, and ambitious decarbonization commitments. In many countries, transport remains one of the largest sources of greenhouse gas (GHG) emissions, with road transport accounting for the vast majority of transport-related emissions. Meanwhile, the transition to cleaner fleets is accelerating, with electric and hybrid vehicles making up an increasing share of new vehicle registrations, while battery-electric bus fleets continue to expand rapidly. Together, these trends are reshaping how organizations plan, procure, and manage energy.
Forward-thinking organizations are already using high-quality energy and fleet data to accelerate decarbonization. With robust energy management and carbon reporting, transport operators can monitor progress against Science Based Targets, optimize fleet electrification strategies, reduce operating costs, improve operational efficiency, and make confident, data-driven investment decisions.
Data for this chart comes from Climate Action Tracker.
How is EnergyElephant Helping Transport & Logistics Organizations?
Unified Fleet & Depot Tracking
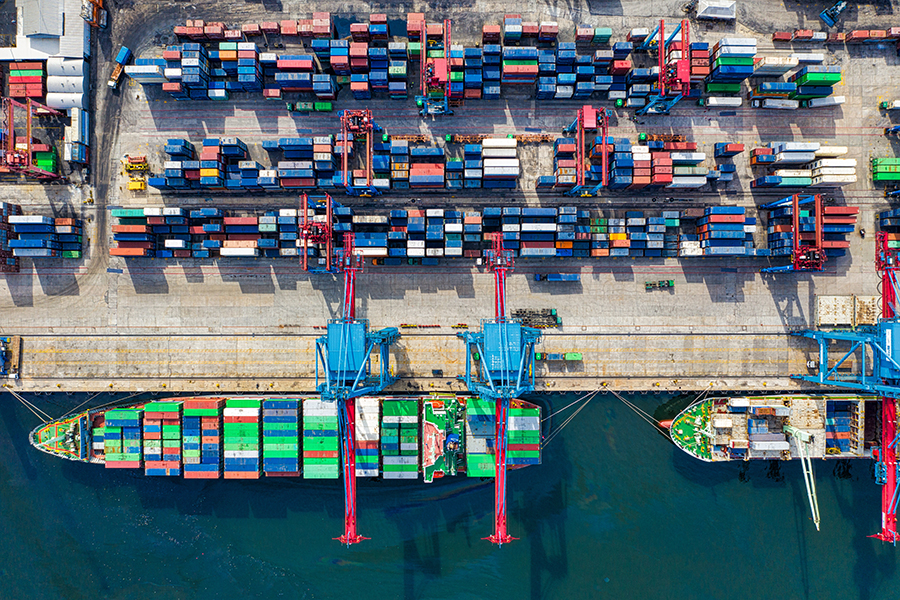
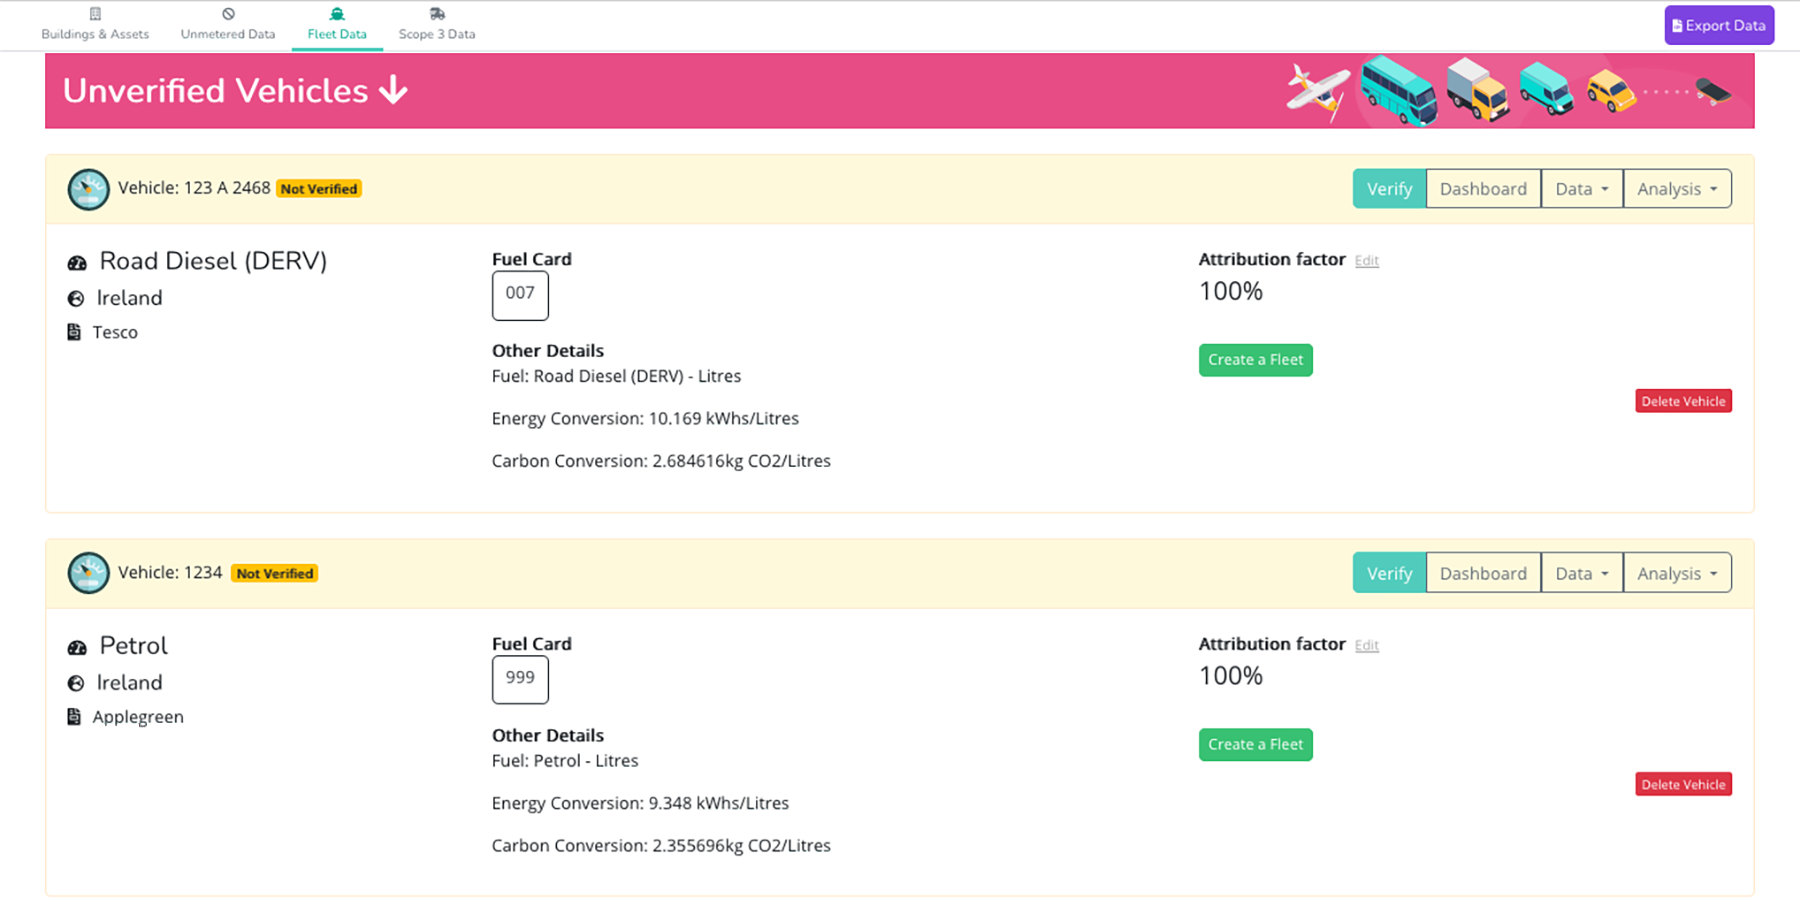
Combine your vehicle fuel use data with depot utility bills and EV charging in one secure platform. See your total energy spend and carbon footprint across all assets – stationary and mobile – in a single dashboard. Covers all vehicle types including cars, buses, trucks, vans, aircraft, ships, trains, and bikes.
Automated Carbon Reporting (Scope 1 & 2)
Eliminate the manual burden of calculating carbon emissions from liters of fuel or kWh of electricity. Our platform automatically applies the latest carbon factors, providing audit-ready reports for ESG disclosures.
Charging Infrastructure Analytics
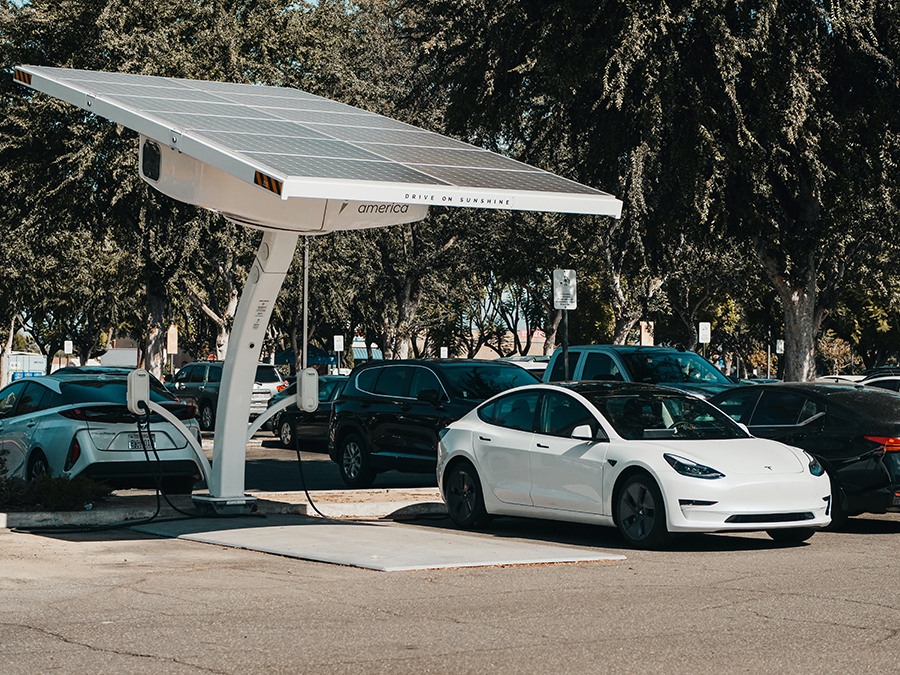
Monitor the impact of EV charging on your depot's electricity capacity. EnergyElephant helps you understand load patterns and identify the best times to charge to minimize costs and peak demand charges. It can also help plan where capacity is lacking before EV charging infrastructure is installed.
Data-Driven Fleet Transition
Use historical fuel and mileage data to build a data-driven business case for electrification. Identify which routes and vehicle types are the best candidates for your next phase of zero-emissions investment.

Additional benefits for transport data management
- Fuel Card Integration: Automatically sync data from major fuel card providers
- Bill Error Detection: Catch overcharges on depot utility bills before you pay
- Custom GHG Exports: Export data formatted for local and international reporting standards
- Driver Engagement: Share progress on sustainability targets to foster a culture of efficiency
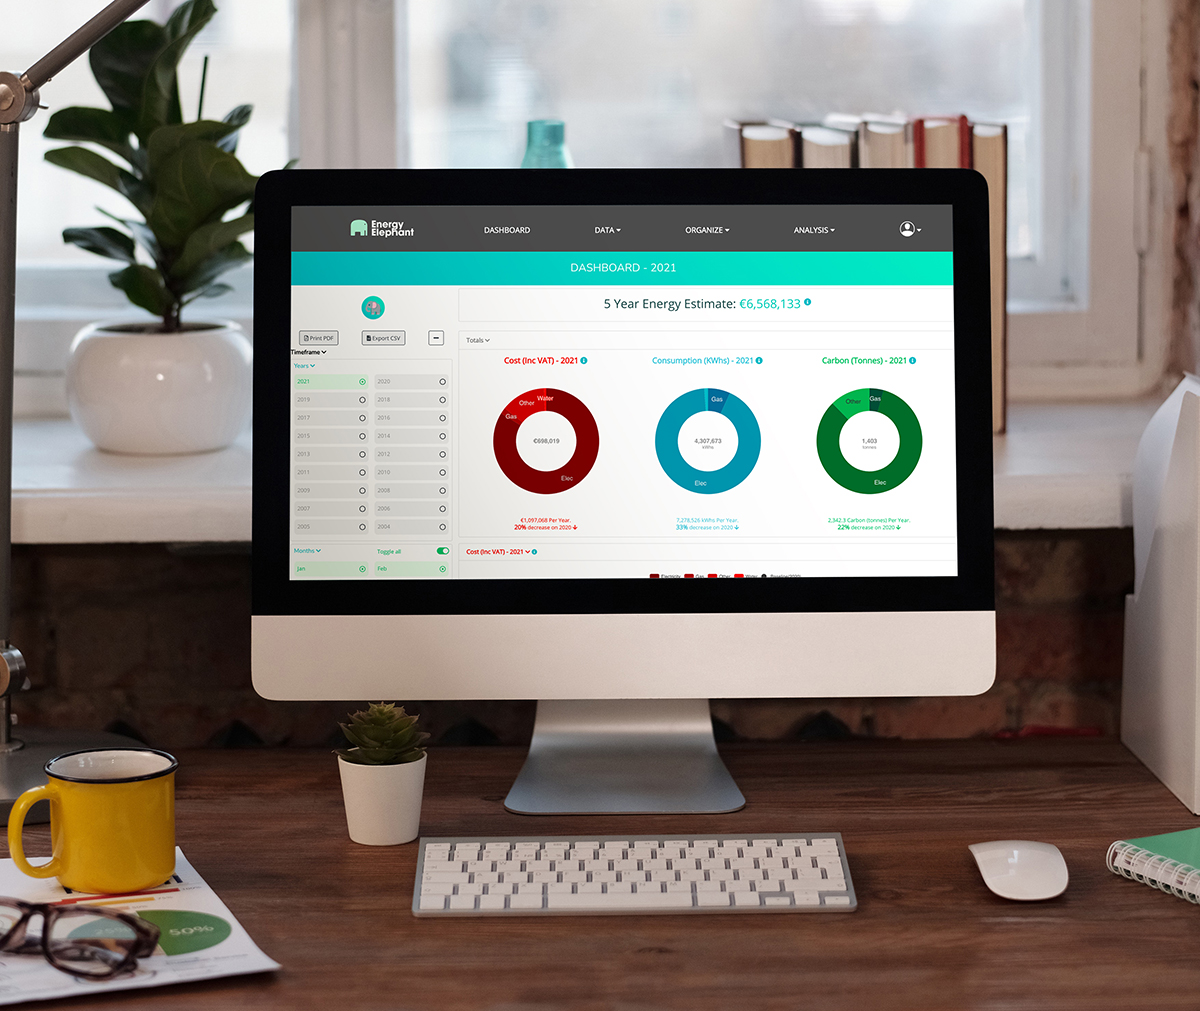
Manage energy data and sustainability data, all in one place
See all of your utility data for cost, usage and environmental impact in one place, with preconfigured dashboards and reports to simplify how you measure, plan, track and act.
EnergyElephant can quickly identify new efficiencies across your sites and save you time on planning projects and reporting results.
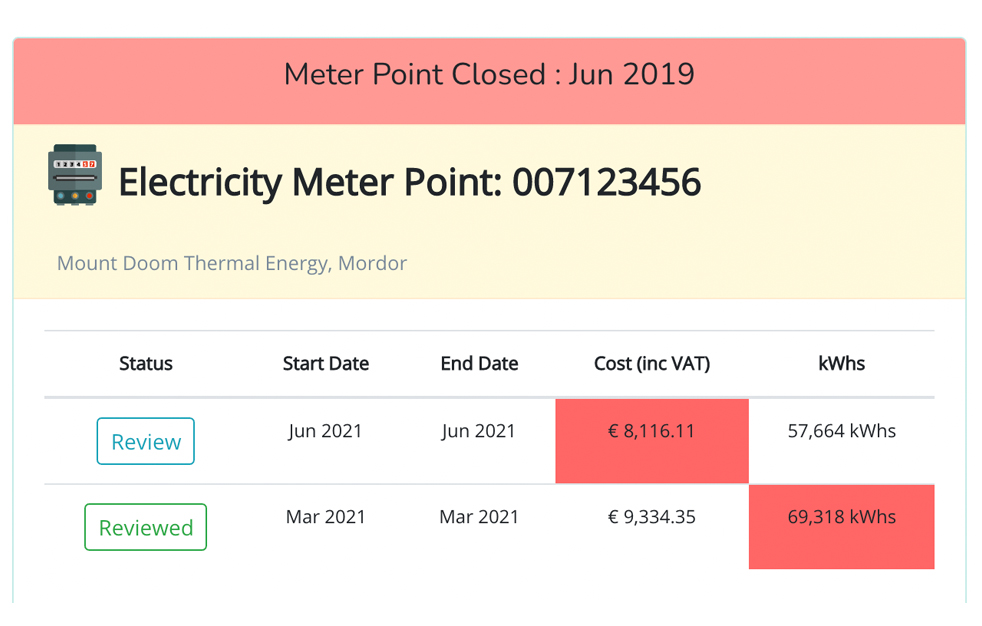
Utility bill validation and management
EnergyElephant can automatically retrieve bills from your supplier and store them, whilst extracting detailed data from each bill.
This simplifies bill checking and data capture so that you can focus on more important tasks and only review bills that are flagged as problematic.
You can also upload your original bills and data in bulk and they will be processed into the system in seconds.
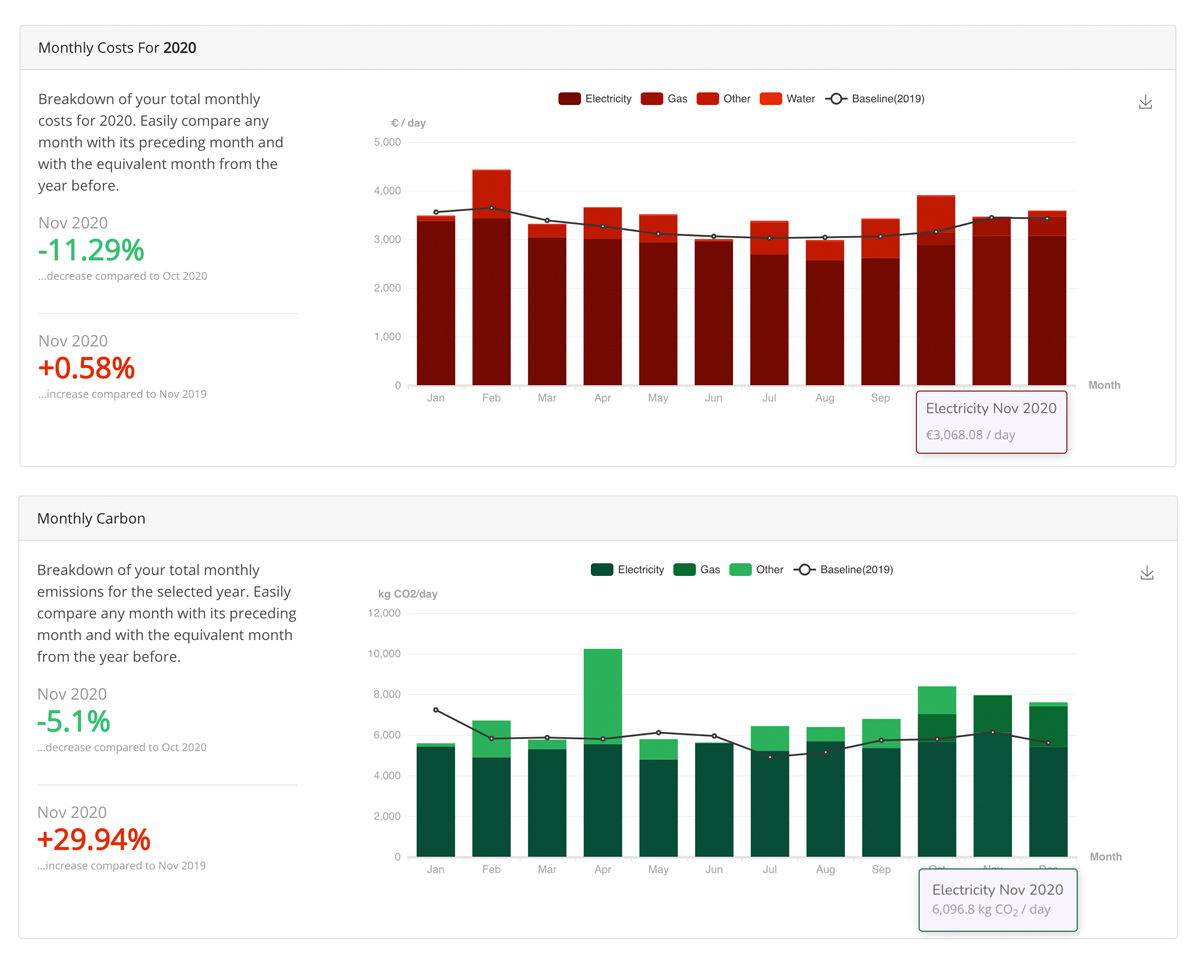
Easy to understand and report
We know that sustainability reports need to be shared with people who are not experts in the area. For that reason we make sure everything in EnergyElephant is easy to understand and simple to use so that you can report and communicate effortlessly.
Share access to specific assets and views with your team or download charts and data for use in your own reports or for reporting frameworks such as Task Force for Climate Related Financial Disclosures (TCFD), Carbon Disclosure Project (CDP) and ISO 50001.
Accounting for energy from your on-site renewables
The ability of organizations to generate their own energy through solar, wind and other renewable sources is a key aspect of the net-zero transition.
EnergyElephant supports effective monitoring and accounting of energy exports via sub-metering.
Identify energy saving opportunities
EnergyElephant visualizes energy consumption to help you identify inefficiencies and respond to problematic trends.
Track energy usage out of hours, monitor start-up and shutdown times and quantify energy baseloads.
Assess performance of divisions and buildings against custom KPIs (such as production activity, staffing, floor area etc.) to clearly quantify efficiency across your organization.

Save money on energy and time for your team
EnergyElephant can keep your costs down by checking your unit rates against competitive rates in the market based on your actual usage.
Based on your consumption it can show you which energy sources are cheaper to use for your requirements.
EnergyElephant also monitors your contract discounts and highlights when its time to switch or renegotiate your contract.
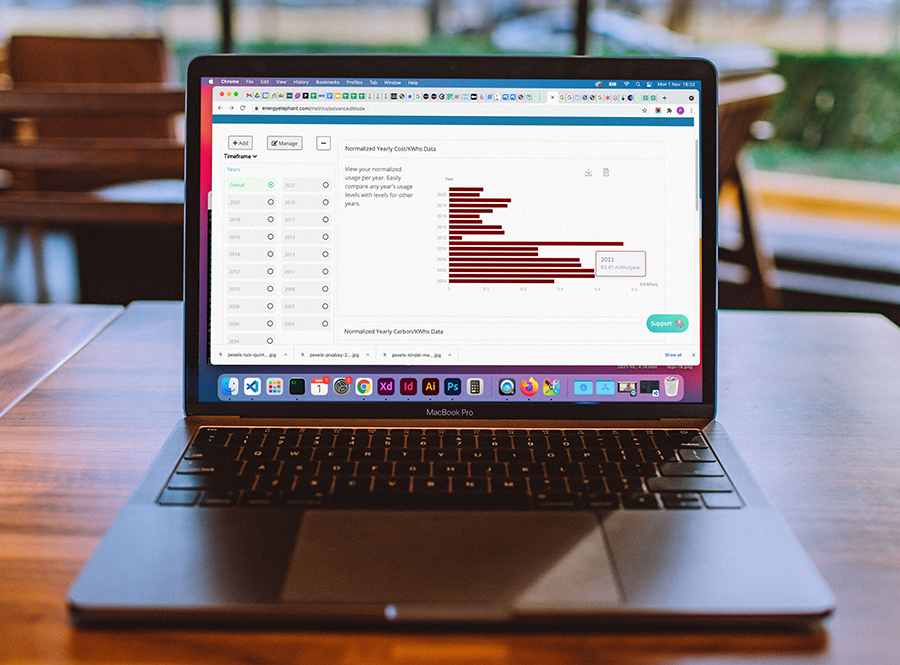
Secure and accessible data for your organization
EnergyElephant secures all of your data in custom designed cloud services, meaning you’ll always have access when you need it.
By centralising your utilities data with EnergyElephant, With EnergyElephant you can change your supplier whenever you want, safe in the knowledge your historic and future data will remain secure and accessible.

Engage Stakeholders & Sustain Momentum
Sustainability success depends on stakeholder engagement. EnergyElephant offers public-facing dashboards to educate staff and patients on sustainability goals, helping to foster a "Green Campus" culture.
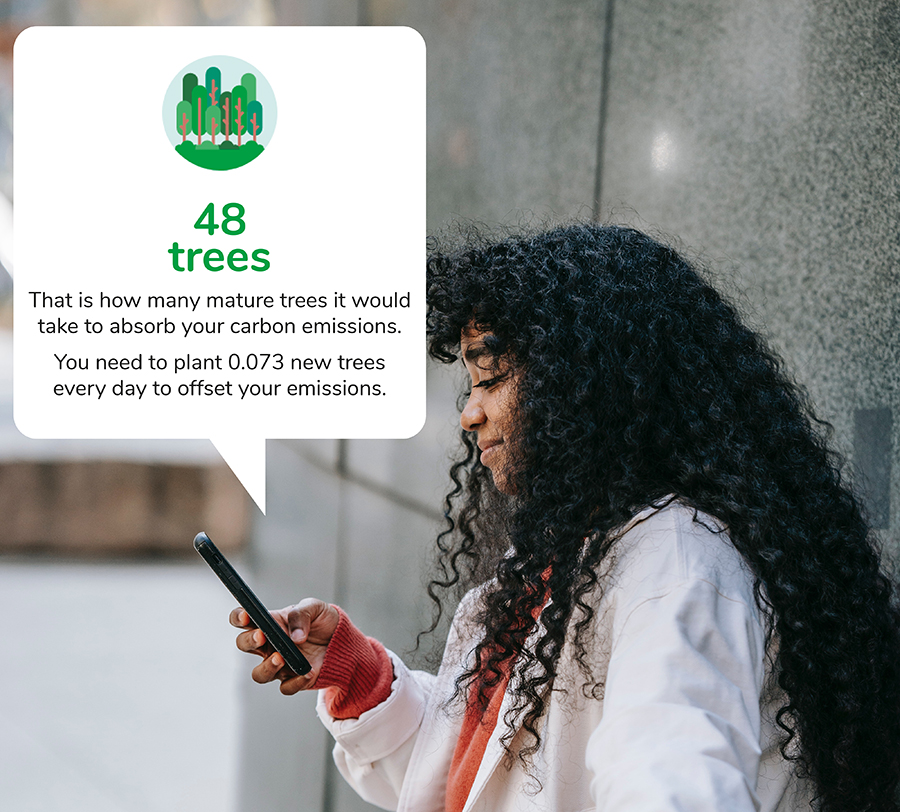
Be more sustainable
EnergyElephant visualizes your use of utilities to help you identify inefficiencies and respond to problematic trends.
Assess performance of divisions and buildings against custom KPIs (such as production activity, staffing, floor area etc.) to clearly quantify efficiency across your organization, in energy, water, waste and emissions.

Carbon price modelling
EnergyElephant enables organizations to set preferred carbon prices and see how their net-zero trajectory is affected.
This supports longer term planning for the financial costs and benefits of transitioning businesses into a cleaner, more sustainable future.

Contact us
We can help you reach your sustainability goals and achieve Net Zero. Let us know the challenges you are looking to solve and our team will be in touch.